NodeGrid Monitoring Aggregation Settings
Here is how to configure a monitoring aggregation.
1) Make sure you have a monitoring license installed.
If you don't have one, add one via System > License
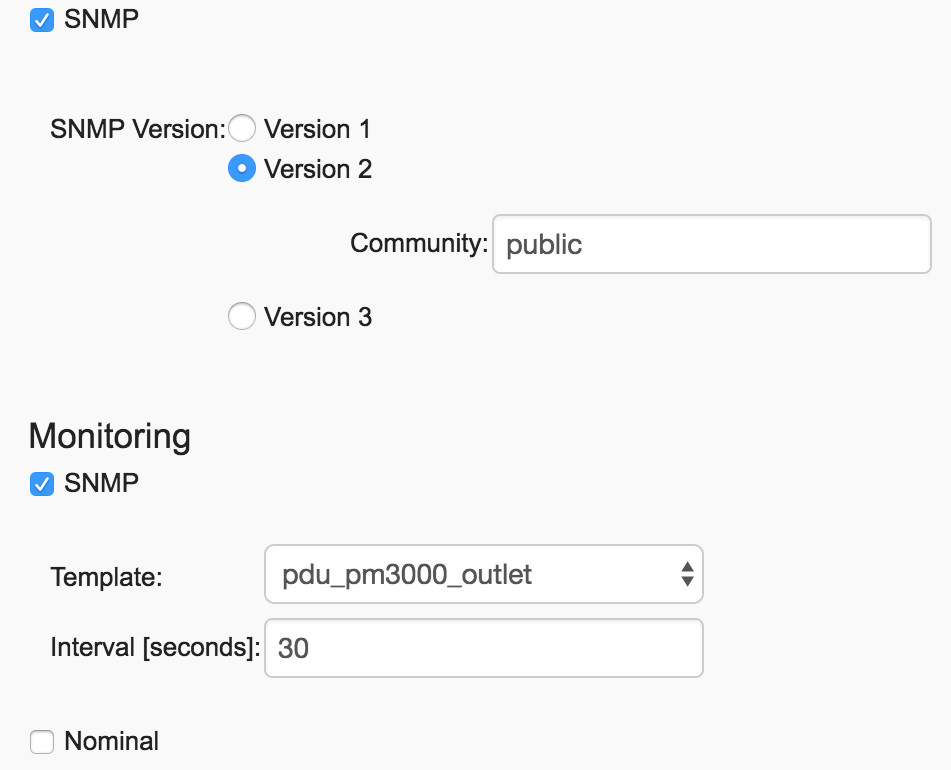
2) Make sure you have the devices you want to aggregate configured and monitoring is enabled.
To enable monitoring, go to Managed Devices > Devices > {drilldown to device} > Management. Make sure the corresponding protocol is enabled and the proper template is selected.
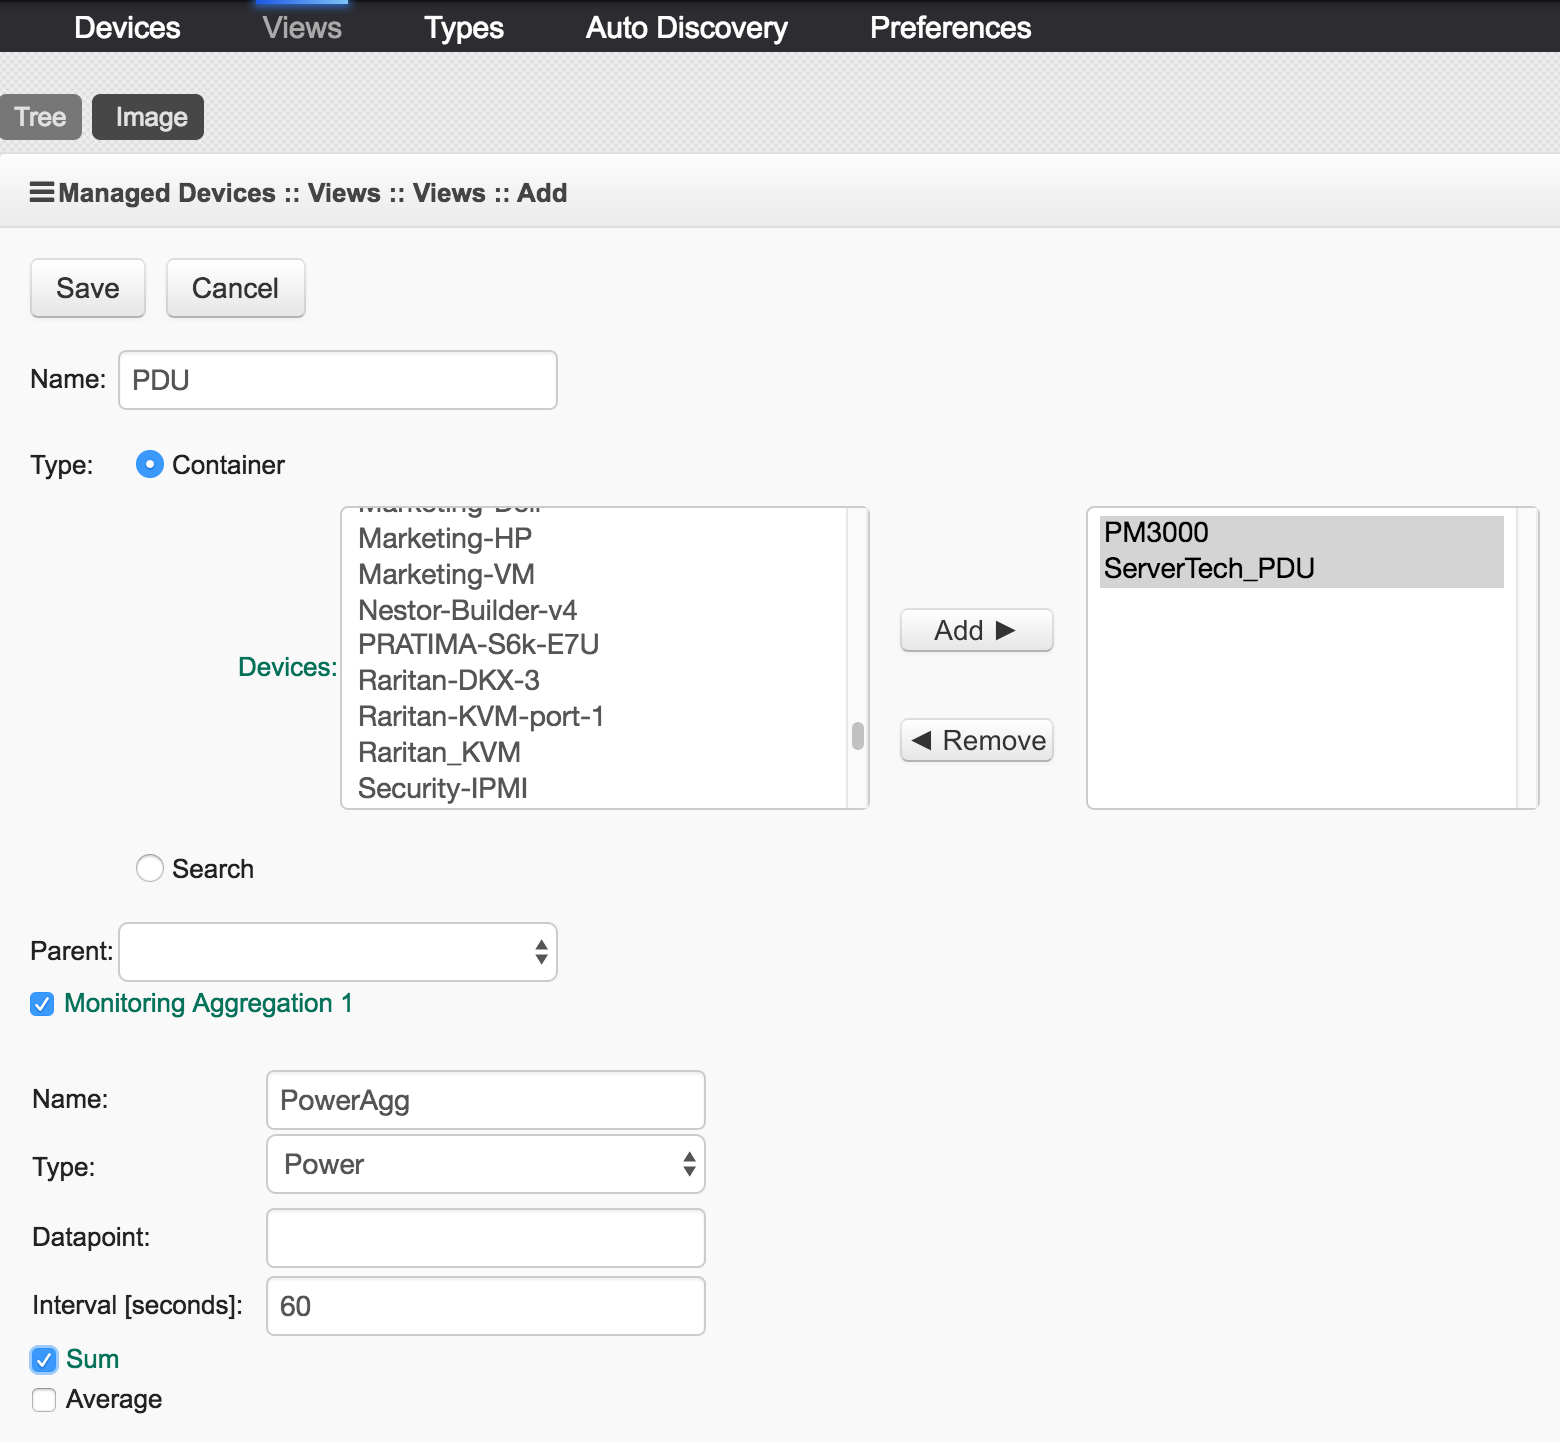
3) Create a container for your devices and enable monitoring aggregation.
Type and datapoint will match the regular datapoints being collected from your devices.
Type is mandatory as you cannot aggregate datapoints from different types. Type corresponds to collectd_type in the collected datapoints.
Datapoint is to filter which datapoints to include in the aggregation. Leave it blank to include all. Datapoint corresponds to type_instance in the collected datapoints.
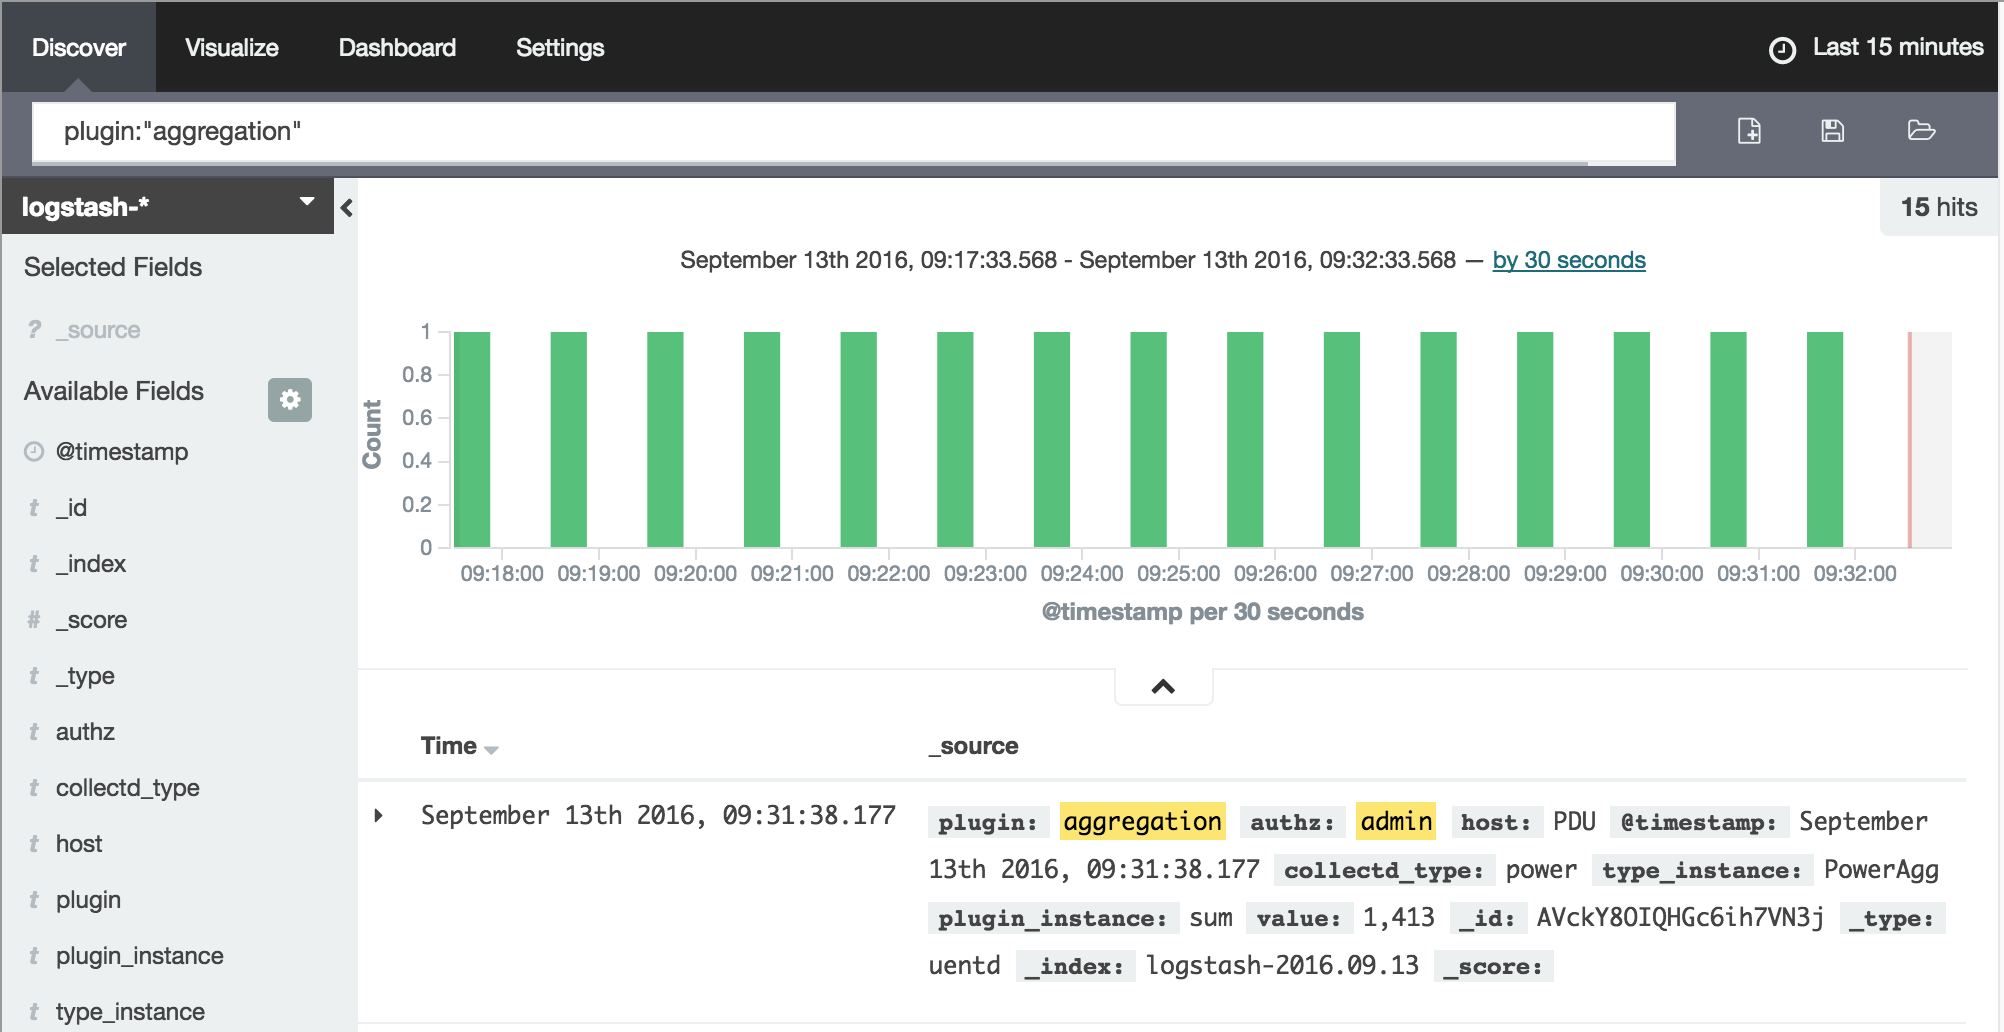
4) Verify that you have data collected from your aggregation.
Under Dashboard > Discover, search for plugin:"aggregation".
You should see some green bars and data instead of the message "no results found". Notice that type_instance is the name you gave to the aggregation.
It may take some time for the aggregation to show up, especially if the aggregation interval configured is big.
5) Create a visualization for you aggregation.
a) Under Dashboard > Visualize, click on Line Chart.
If Line Chart is not visible because a visualization has already been selected, click on the icon to create a new visualization: ![]() .
.
b) Click on From a saved search and select logstash-* as the index pattern.
c) In the search field, enter plugin:"aggregation" AND type_instance:"PowerAgg". PowerAgg is the name you gave to the aggregation when configuring it, so change it accordingly.
d) Expand Y-Axis by clicking on the arrow and select Aggregation as Average and Field as value.
e) Expand X-Axis and select Date Histogram.
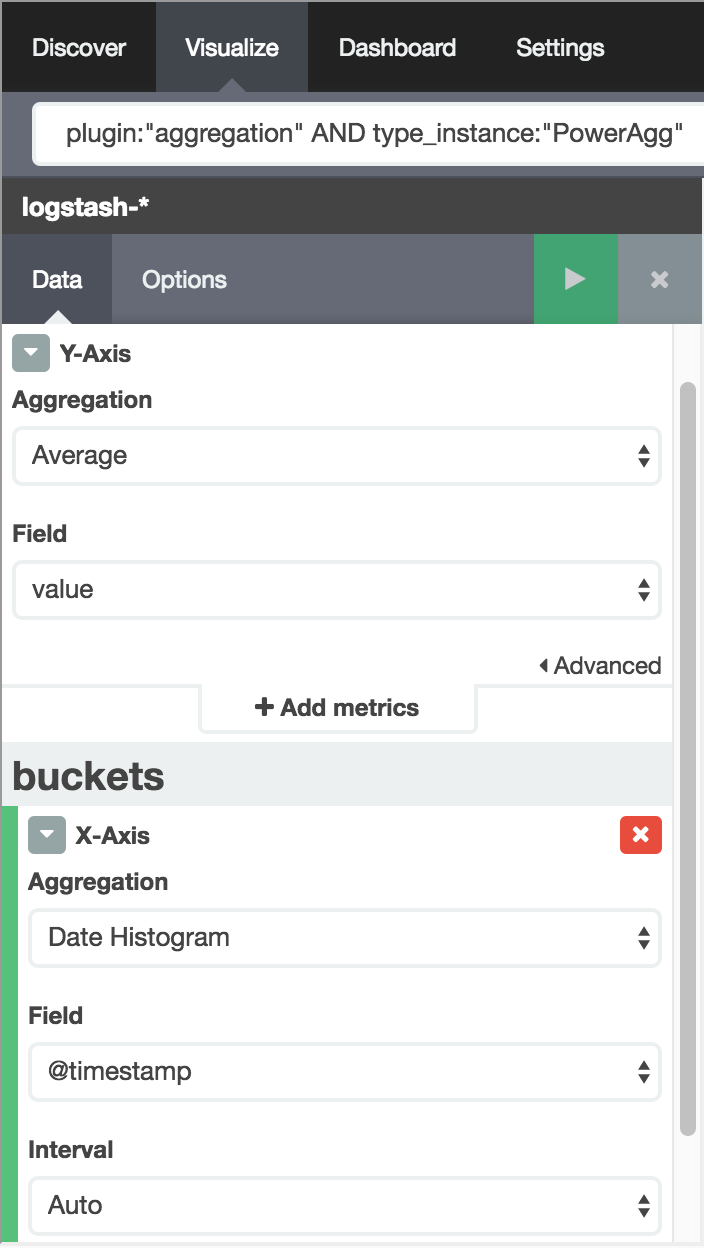
f) Visualize the graph by clicking in the green arrow.
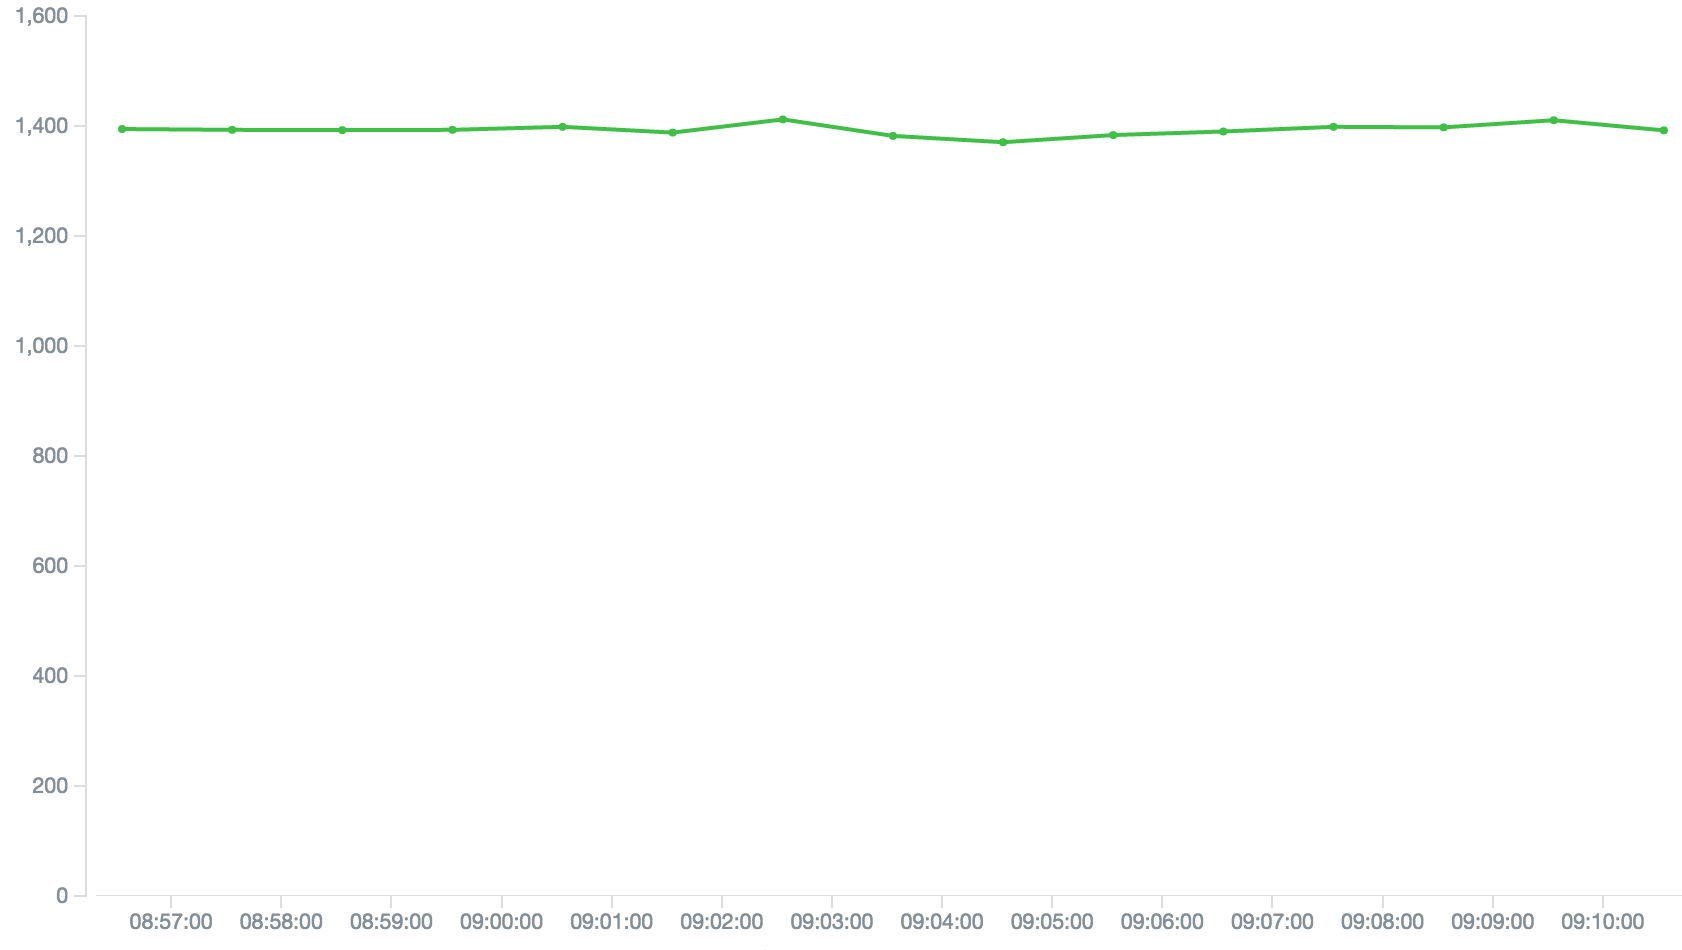
g) Save the visualization. Click on the save icon ![]() , give it a name and click on the Save button.
, give it a name and click on the Save button.
6) Add the visualization to the Dashboard.
Go to Dashboard and click on the icon to add a visualization and then select the visualization you just created.
Optionally, you can change the size and position ![]() of your aggregation visualization by using your mouse.
of your aggregation visualization by using your mouse.
You need to save the changes you made to your dashboard, by clicking on the save icon ![]() and clicking on the Save button.
and clicking on the Save button.
Related Articles
Steps to create a monitoring dashboard of a PDU
Please, follow the instructions of the following articles, in this order: 1. Enabling Monitoring 2. Exploring Data Points 3. Creating a Visualization 4. Creating a Dashboard 5. Inspecting a Dashboard 6. NodeGrid Monitoring Aggregation Settings 7. ...Creating a Visualization
Perform the steps below to create a visualization, graphing the data collected. 1. Click on Visualize: 2. Select a Line chart: 3. Select a search source by clicking on ‘From a new search’. 4. Select ‘logstash-*’ as index pattern. 5. Select the data ...Enabling Monitoring
Perform the steps below to enable monitoring for a device, using the interface of your choice, either the CLI or the web. Using the CLI Go to the device’s management settings: cd /settings/devices/<device_name>/management/ Configure monitoring for ...export_settings and import_settings
The export_settings and import_settings are CLI features that allow you to export/import the entire or partial (subtree or the configuration of a given path) configuration in a text format. The input and output can be a file or standard input/output ...Customizing a Monitoring Template
There are a number of pre-existing monitoring templates, and if any of them satisfies your needs you can skip to the next section. All templates are text files located under the directories /etc/collectd.templates/snmp /etc/collectd.templates/ipmi ...