Exploring Data Points
This section will describe how you can verify that we are actually persisting the data collected and to learn more about the data being collected. This knowledge will be helpful in the Creating a Visualization article.
First, make sure that you have a valid Monitoring License added to the Nodegrid. Check System : : License, Details column.
Then, you can explore the raw data points collected by performing the steps below.
1. Click on Dashboard.
2. Click on Discover.
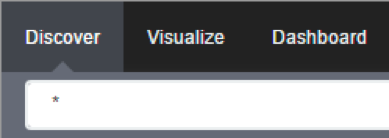
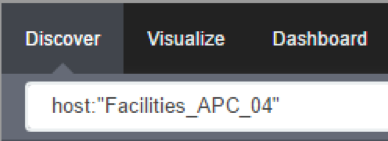
3. Optionally, search for the device you configured in the previous section.
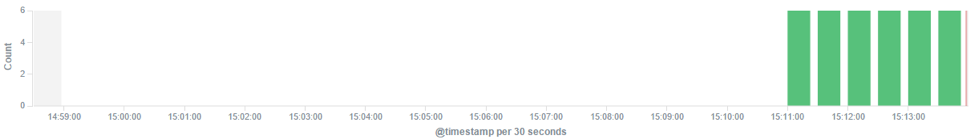
4. Verify that you have data points.
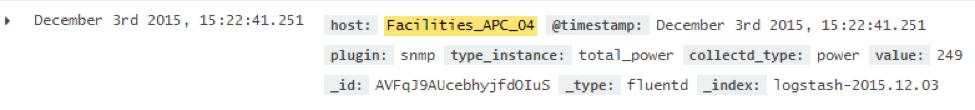
5. Inspect the available fields in each data point.
As the collected data is buffered before being persisted, it may take a couple of cycles before you can visualize the persisted data.
There are numbers of fields that can be used in the search expressions that will be used in the next section. They are:
- Data point fields:
- 1. host
The name of the device being monitored. - 2. plugin
The name of the plugin collecting the data. Possible values are:- 2.1. snmp
- 2.2. ipmi
- 2.3. nominal
- 2.4. aggregation
- 3. plugin_instance
The instance of the plugin collecting the data, if the plugin requires it. Present in the aggregation plugin, possible values are:- 3.1. sum
- 3.2. average
- 4. collectd_type
The type of the measurement. Possible values are:- 4.1. temperature
- 4.2. humidity
- 4.3. fanspeed
- 4.4. timeleft
- 4.5. power
- 4.6. apparent_power
- 4.7. power_factor
- 4.8. current
- 4.9. voltage
- 4.10. frequency
- 4.11. percent
- 4.12. counter
- 5. type_instance
The name of the element associated with the measurement. For example, a PDU’s outlet or bank would show up as type_instance.
- 1. host
- Device fields:
- 1. name
The name of the device being monitored. - 2. mode
The operational mode of the device. Possible value are:- 2.1. enabled
- 2.2. ondemand
- 2.3. disabled
- 3. type
The type of the device. Possible values are:- 3.1. ilo
- 3.2. drac
- 3.3. idrac6
- 3.4. ipmi_1.5
- 3.5. ipmi_2.0
- 3.6. cimc_ucs
- 3.7. device_console
- 3.8. pdu_apc
- 3.9. pdu_mph2
- 3.10. pdu_pm3000
- 3.11. pdu_raritan
- 3.12. pdu_servertech
- 3.13. pdu_enconnex
- 4. family
The family to which the device is a member. Possible values are:- 4.1. ilo
- 4.2. drac
- 4.3. ipmi_1.5
- 4.4. ipmi_2.0
- 4.5. cimc_ucs
- 4.6. device_console
- 4.7. pdu
- 5. addr_location
The configured location for the device. - 6. coordinates
The coordinates for the device. - 7. ip
The IP address of the device. - 8. mac
The mac address of the device, if known.
As MAC addresses have colon in its address, which is understood by the query syntax to separate the field name from its field value, we will need to escape it:
"00\\:02\\:99\\:11\\:B7\\:1D" - 9. alias
The IP address alias assigned to the device. - 10. groups
The authorization groups to which access to this device have been granted. - 11. licensed
If the device is licensed or not. Possible values:- 11.1. yes
- 11.2. no
- 12. status
The current status of the device. Possible values:- 12.1. connected
- 12.2. disconnected
- 12.3. in-use
- 12.4. unknown
- 13. nodegrid
The hostname of the NodeGrid that controls the device.
- 1. name
- Custom fields
Any custom field configured for the device.
Related Articles
Steps to create a monitoring dashboard of a PDU
Please, follow the instructions of the following articles, in this order: 1. Enabling Monitoring 2. Exploring Data Points 3. Creating a Visualization 4. Creating a Dashboard 5. Inspecting a Dashboard 6. NodeGrid Monitoring Aggregation Settings 7. ...Customizing a Monitoring Template
There are a number of pre-existing monitoring templates, and if any of them satisfies your needs you can skip to the next section. All templates are text files located under the directories /etc/collectd.templates/snmp /etc/collectd.templates/ipmi ...NodeGrid Monitoring Aggregation Settings
Here is how to configure a monitoring aggregation. 1) Make sure you have a monitoring license installed. If you don't have one, add one via System > License 2) Make sure you have the devices you want to aggregate configured and monitoring is enabled. ...How to: Add OpenSearch Temperature visualization to Nodegrid
The Dashboard (WebUI only) allows visual presentations of Event activities, Managed Device details, and data monitoring. Multiple dashboards can be created for different purposes. For example, one to monitor managed device data points (i.e., Power ...Enabling Monitoring
Perform the steps below to enable monitoring for a device, using the interface of your choice, either the CLI or the web. Using the CLI Go to the device’s management settings: cd /settings/devices/<device_name>/management/ Configure monitoring for ...